Whenever Openmet carries out a project to measure customer satisfaction, we try to include in the conclusions of our reports one of the analytical tools offering the most scope when considering potential improvement plans, discussing possible priorities, and even sparking heated debates between managers when we present the results. They are what we call Importance – Satisfaction decision charts.
In this article, we want to quickly show you what these charts are and how to interpret them.
Importance – Satisfaction charts are obtained by charting, for each question or KPI (indicator) in a survey, the importance of the item and its score on the satisfaction scale:
- The importance of each item is usually obtained in two possible ways: by asking customers directly (Explicit Importance) or by deducing its importance from statistical calculations (Inferred Importance).
- The satisfaction for each item is generally obtained by asking customers directly (the typical questions in a satisfaction survey, usually scored on a scale of responses).
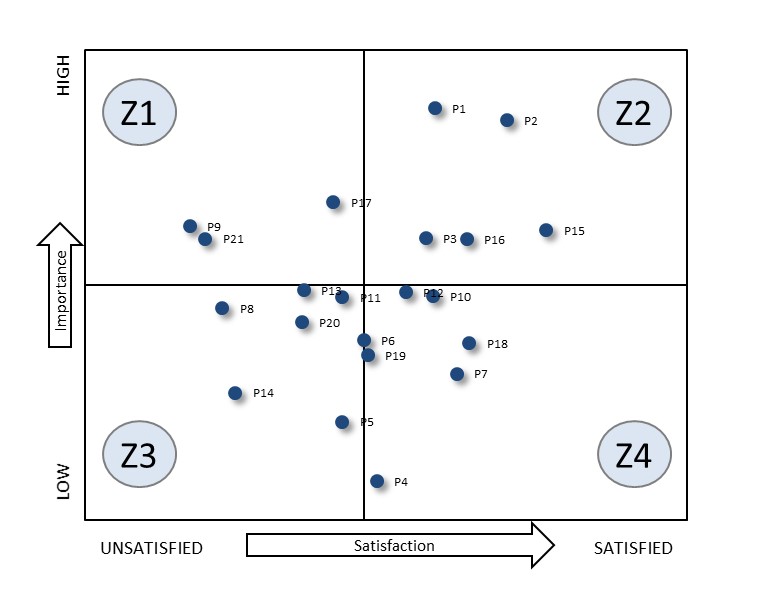
The following chart contains an example where 21 items of a satisfaction survey (in this case they are questions, but they could be indicators) have been charted as described above:
The chart is split into four quadrants or sections to help interpret the results of the items in the satisfaction survey:
Section 1 (Z1): Low satisfaction and High importance
The items in this section (e.g. P9, P21 and P17) are aspects that customers consider important and which they are dissatisfied with. When drawing up improvement plans, we will normally make this area a priority. There is clearly room for improvement with these items, which require further investment and closer attention.
Section 2 (Z2): High satisfaction and High importance
The items in this area are aspects that customers consider important and with which they are satisfied. With regard to improvement plans, this section contains items where a good job is being done; they are usually the strengths of the product or service being evaluated or of the company. The focus and investment are usually adequate and should be maintained.
Section 3 (Z3): Low satisfaction and Low importance
The items in this section are aspects that customers consider to be of little importance and with which they are dissatisfied. When defining improvement plans, this section contains items that should be given low priority. We can maintain a low investment and focus, but keep in mind that if the dissatisfaction with these items worsens, we run the risk of them migrating to Z1.
Section 4 (Z4): High satisfaction and Low importance
The items in this area are aspects that customers consider unimportant and with which they are satisfied. When defining improvement plans, this section contains items that should be given low priority and can be candidates for disinvestment or a maintenance investment.
Conclusion
To conclude this article, Importance – Satisfaction decision charts are a very useful tool for ensuring a good analysis of the results of a customer satisfaction study by offering:
- An engaging and quick overview of the results
- An easy-to-use preliminary guideline for decision-making that categorizes results into different quadrants


