NPS surveys

Improve your customers' experience with the NPS methodology

NPS® consultancy and software to know what your customers experience and how to improve. We help you design the surveys, interpret the results, and build an action plan that increases their loyalty.

Request more information
Net promoter score Official Bain license Results platform Custom surveys

Hundreds of companies trust Openmet

OFFICIAL NPS

Official Bain license to work with NPS

We are one of the few companies in the world certified by Bain & Company to apply the Net Promoter Score (NPS) methodology.

  • Certified methodology.

Why an NPS methodology?

We help you turn your customers' feedback into a loyalty engine

Orient your company toward your customers

NPS classifies your customers as promoters, passives, and detractors. You know who recommends you, who is indifferent, and who is about to leave and why.

Increase loyalty and referrals

Promoters buy more, repeat, and bring in new customers at no acquisition cost. You identify what makes them promoters so you can replicate it, and what turns a customer into a detractor so you can fix it in time.

Make improvement decisions with real data

Each wave gives you a metric comparable over time and against the market. You know whether your actions are working, which touchpoint creates friction, and where it’s worth investing.

Capture feedback

We design the NPS questionnaire and manage the entire capture process

We help you understand your customers’ experience (B2B or B2C), define a good NPS questionnaire, and set up a recurring survey process geared toward continuous improvement.

  • Custom NPS questionnaire: we design the right questions for your sector and customer type.
  • Multi-channel and flexible frequency: by email, web, SMS, phone, or on-site. Daily, weekly, quarterly, or yearly. Through the channel and at the pace that works best with your customers.
  • CRM integration: if needed, we integrate with your internal software to automate the sending of the surveys.
  • Multilingual: surveys in any language for global customers and teams.
  • Alerts: we notify you automatically when there are detractors or low scores.

Analyze the results

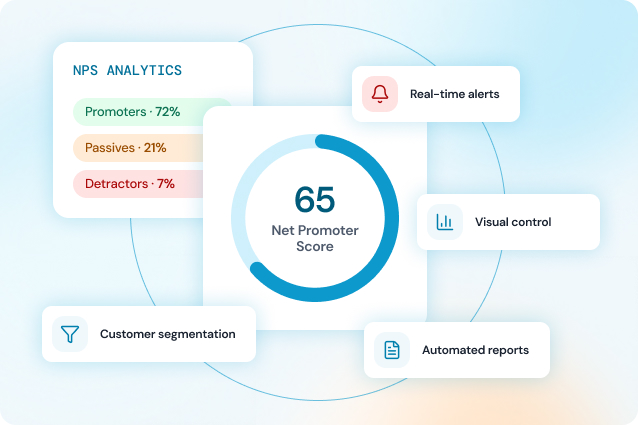
Visualize your NPS and other metrics with Openmet Feedback Manager

Our NPS software lets you analyze data in real time and reports we help you interpret.

  • NPS, KPIs, and Customer Journey: view your NPS, the distribution of promoters, passives, and detractors, and visualize every touchpoint of the customer experience.
  • Segmentation, weighting, and filters: filter, compare, and weight by customer type, territory, product, or any internal variable that matters.
  • Understand how to improve: view automatic SWOTs, customer histograms, and statistical data that will help you understand how to improve.
  • Automatic reports: generate automatic reports in Word, PDF, and Excel and share them.
  • Real-time alerts: receive notifications when a customer is unhappy so you can react immediately.

Act on data

Make decisions to improve the customer experience

Our NPS specialist consultants help you understand what the data is saying and turn it into concrete improvement actions.

  • Methodology and expert consultancy: we apply Kano, NPS, Gaps, and other frameworks to analyze responses and detect where you can improve.
  • Interpretive reports: we analyze the results and present them to you with clear conclusions.
  • Benchmarking: we compare your NPS with that of your sector to see where you stand out and where you fall short.
  • Priorities: we identify which aspects of the product or service weigh most in satisfaction and where you gain the most by improving.
  • Action plans with Openmet YouMakePlans: we define objectives, assign owners, and track each improvement with our action plan management software.

Your partner

Why choose Openmet?

20+ years of real-world experience

Over two decades helping companies across every sector understand and improve their relationship with their customers.

500+ companies vouch for us

The trust of hundreds of clients certifies the strength and reliability of our methodology.

Proprietary technology

Business Intelligence software to analyze results and make data-driven decisions.

Comprehensive expert guidance

More than a platform. We're a customer satisfaction consultancy that helps you execute and measure every improvement.

AI-augmented consultancy

More time with you, less spent on document production. We let artificial intelligence work in the background so we can focus where we add value.

Get started with the NPS methodology today


    By starting, you accept the privacy policy.

    FAQS

    We answer your questions about NPS surveys

    What is the NPS (Net Promoter Score)?

    The NPS (Net Promoter Score) is an indicator that measures customer loyalty toward a company, product, or service based on a single question: “How likely are you to recommend us to a friend or family member?” (that’s the B2C version; it can vary slightly if the market is B2B). Customers respond on a scale from 0 to 10 and are classified into three groups: promoters (9-10), who are enthusiastic and drive growth; passives (7-8), who are satisfied but not engaged; and detractors (0-6), who can harm the company’s reputation. NPS is today one of the most widely used indicators worldwide for its simplicity and its ability to predict business growth.

    What is an NPS survey?

    An NPS survey is the data collection tool that lets you obtain the Net Promoter Score. In its most basic form it includes the recommendation question (0-10 scale) and an open-ended question asking the customer the reason for their score. This combination of quantitative and qualitative data is what makes the NPS survey especially useful: the number indicates the state of the relationship, and the open comment explains the reasons behind it. At OpenMet we design NPS surveys tailored to each context, channel, and moment of the customer lifecycle to maximize the response rate and the quality of the feedback.

    How many questions does an NPS survey have?

    The classic NPS survey has few questions: the recommendation question (0-10 scale) and one or two more questions (open or closed) to understand the reason for the rating. In practice, between three and five additional questions are often added to dig deeper into specific aspects of the service, such as quality of attention, ease of use, or value for money. The key is to keep the survey brief: the shorter it is, the higher the response rate.

    How is the Net Promoter Score calculated?

    The calculation is simple: subtract the percentage of detractors (customers who scored between 0 and 6) from the percentage of promoters (customers who scored 9 or 10). Passives (7-8) don’t enter the formula, but they do count toward the total responses. The result is a number ranging from -100 (all customers are detractors) to +100 (all are promoters). For example, if from a sample of 200 customers 50% are promoters, 30% passives, and 20% detractors, the NPS would be 50 – 20 = +30.

    What's a good NPS result?

    It depends on the sector, but there are general benchmarks. An NPS above 0 indicates that there are more promoters than detractors, which is already positive, but the truth is that it’s only with an NPS between +20 and +40 that it’s considered favorable. Above +50 is excellent, and above +70 is exceptional, reserved for companies that lead in customer experience. That said, what matters most is not the absolute number but the evolution over time and the comparison with your sector.

    BLOG

    Latest articles

    News, tools, techniques, and advice on NPS surveys and methodology

    work environment

    Commitment: Points to analyze in a work environment survey

    This article attempts to show the keys to OpenMet’s work environment model based on EFQM. In the 5F model, "The 5 factors for assessing human and organizational potential", the first factor is Commitment. Commitment is composed of three major indicators that orient the keys to this factor. These are: Strategy and culture, Engagement and Loyalty. 1. Strategy and culture. This indicator will help us to understand the Strategy on the one hand: whether our employees are aware of the company’s goals, their role in the company, whether they sense that the organization trusts its people and the vision of future prospects. This is critical to understanding whether "we are all headed in the same direction.” Culture is analyzed through Management’s orientation to recognition, alignment with the goals of the latter and knowledge of and adherence to the values ​​and culture of the company. 2. Engagement. This is the second indicator of the Commitment factor. Engagement concerns direct vision, the work itself, and – indirectly – the organization. Awareness of the objectives and their clarity and willingness to work over and above what is expected are the items that best represent this direct vision. The pride of belonging to the company and even the department are key for organizational engagement. 3. Loyalty. In this indicator, several general items are analyzed that we can consider key and as having the greatest influence on commitment. On the one hand, the perception of being a good place to work and contentment with the work done as an employee and, on the other, the recommendation to others as a good place to work and repetition in the choice of current company. In summary, Commitment in the 5F work environment model relates to strategic aspects of the company, the future vision of the company, the alignment with values ​​and culture, engagement with one's own work and with the organization, loyalty to the organization, recommending to others, pride in what is done and the general perception of the company as being a good place to work. More information on Work Environment.

    survey analytics

    Survey analytics: Distribution of answers

    Survey Analytics – Distribution of Answers The first analysis of the results of a customer satisfaction survey, customer experience or NPS is typically hierarchical or dimensional. This analysis involves analyzing the various questions and indicators of the survey to understand WHAT is working well and which aspects are considered good or bad. If we have also included additional survey questions, following a similar strategy to that described in the article Improving on NPS Surveys, we can determine the WHY of the assessments obtained. Adding to the survey with extra questions will also help us to determine the priority of the dimensions or items with a decision-making chart like the ones described in the article Importance-Satisfaction Decision Charts . Analysis of distribution Another type of question to answer is WHERE things are happening. For example, for which sector or in which delegation is overall customer satisfaction greatest. This question may be asked about general satisfaction or the measurement of a particular dimension, such as "commercial aspects" or "aftersales service" or even an item of the survey. Distribution Analysis helps us to understand WHERE the WHATs of the previous paragraph are happening. For this analysis, we first need to select the range of scores that we want to analyze. In the chart below, it is the range of best scores (specifically the range of scores between 66 and 100). Having selected the scores, we will see how they are distributed across the demographic variable we wish to study (in the figure in our example, Sector) in comparison to all survey answers. Continuing with the chart in our example, we see that the ‘Industry’ sector has a high percentage of ‘highly satisfied’ customers compared to the percentage of customers who answered from this sector. By comparing the distribution of the selection with all of the customers surveyed, we can identify the delegations, sectors, areas, etc. with a percentage of higher scores than the survey overall. We can use this type of analysis to understand the distribution of our most satisfied customers, of our most dissatisfied customers or of our most ‘neutral’ ones, both generally and for any of the survey dimensions. Distribution analysis + CRM In the previous point, we suggested a classification of the most and least satisfied customers using the data we have available, which are the demographic variables included in the survey. This way, we are able to identify where things happen. Distribution analysis is particularly useful when we have information on the people who answered the survey. This is done by linking the survey data with the company CRM and allows us to move from the previous WHERE to the WHO. This way, we can find out who are our most satisfied customers and who are the most dissatisfied ones – and hence, in the danger zone. We can use this information to conduct specific sales campaigns for satisfied customers (perhaps promoters, in NPS terms) and others to try to avoid losing customers in the danger zone. This article has outlined the benefits of distribution analysis. Firstly, it allows us to identify WHERE good and/or poor scores are given for the items/dimensions in our survey and, when combined with CRM data, it allows direct identification of WHO our satisfied/loyal/etc. customers are and which ones are in the danger zone, so that we can make the appropriate business or sales decisions for each case. More information on Electronic Surveys.

    electronic customer surveys

    Electronic customer surveys: Asking more with fewer questions

    In our day-to-day work as a firm that conducts customer satisfaction and experience projects and surveys, we often come across the same dilemma:We want to ask and find out lots of details about our customers…But we can't ask everything we’d like to because the survey would be too long (which would lead to other problems such as abandonment, poor quality responses and increased costs, among others)Electronic customer surveys.In this post, we outline three basic strategies that we use in customer surveys to solve this problem at least in part and achieve what may otherwise seem impossible: ask more with fewer questions.Three basic strategies for asking more with fewer questions in electronic surveys1. Pre-segmentationThis strategy could alternatively be called “Never ask what you already know”. Although it may seem obvious, many customer surveys and forms do not heed this rule and ask customers about aspects that are already in the company databases. This should never happen. A good survey should pre-load this data to make it available during the survey and results analysis and not pass on to customers the internal data management shortcomings of the company.Generally, two typologies of customer are surveyed:A. “Known” customers (or B2B customers, on whom we already have information in the CRM or other data sources).These customers are in the company database and we probably already have information on aspects such as:The name of the customer or their addressThe area where they live or the store where they usually buyThe type of products or services that the customer purchasesTheir annual revenue or classification in the customer ABCThe sales channel they use… and many othersB. "Unknown" customers (or B2C customers, anonymous customers, such as customers who go to a restaurant chain or visit a website).Although these customers are not in the databases, it is also possible to pre-segment them using information that we may already have, such as the geographical area or establishment where the survey is conducted. We can also obtain automatic information on customers through other means, including the use of social WiFi (the customer gets free wireless access in exchange for sharing details of their social profile). 2. Conditional questions and answersWe could also call this strategy “Don’t ask what doesn’t concern you”. The aim is to make sure – based on the responses and customer data we already have – that all the questions asked of a customer are relevant and can be answered.To adapt the survey to the customer profile, we need to use conditional questions and answers, hiding and showing whole parts of the customer satisfaction survey based on the information we already have. For example, if we have preloaded customer data, we can ask only about the specific product or service that we know they use.The ultimate aim is to ensure that all of our questions are relevant and can be answered by the customer and that we are not wasting our "shots" (or questions) unnecessarily. 3. Random questionsThis strategy could also be called “Divide and conquer” or “Jigsaw survey”. The idea is to divide the survey into parts as small as we would like so that each customer only answers a few questions. The questions will be different for each customer.This system allows us to obtain aggregate results (responses from all customers) with data on answers to lots of questions, but with partial samples for each. In other words, we can design a survey that is as complex as we like provided that our sample is large enough to be divided into small parts that can be selected at random to minimize any bias (most survey software incorporate this option). ConclusionTypically, a good satisfaction survey design gives us far more information on customers – both their characteristics and their opinions – without having to answer to tiresome questionnaires.Three possible strategies are:pre-segmentationconditional questionsrandom questionsWith these strategies we can achieve the seemingly impossible: ask more with fewer questions.